Bell Curve: 68-95-99 Rule | ||
| ||
Introduction | ||
This lesson page will teach you about standard deviation. Here are the sections within this lesson page:
|
When the term bell curve is mentioned by statisticians, they are referring to data that takes on a certain characteristic shape. The shape of the data appears like a huge bulge -- tall in the middle and short to the left and right sides. The terms bell curve and normal distribution are synonymous. The bell curve shape looks like this:
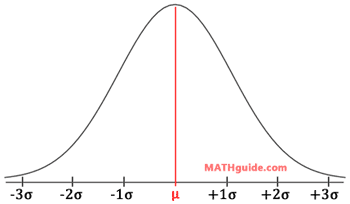
Notice that the curve is symmetric, has the mean (μ) in the center, and several standard deviations (σ) left and right of the mean are drawn.
| |||||
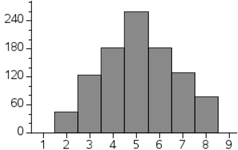
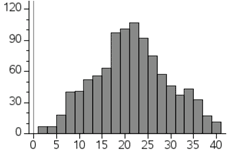
When two dice are rolled and their sum is recorded for many rolls, this generates bell curves. For instance, here are the graphs of two such scenarios. Here are two histograms.
On the left, this is the result of rolling two 4-sided dice 1000 times. On the right, two 20-sided dice were rolled 1000 times. [In both cases, the dice were not hand-rolled. Our interactive quiz, called Dice Roller: Mean, Standard Deviation, was used.] The two histograms, while not perfect, indicate that there are scenarios where the data is lumped about the mean of the data and the graphs lose height while either moving left or right from the mean. The same situation would likely arise if we were to go to a high school and get all the shoe sizes of the females of a certain grade-level. We would have most shoe sizes close to the mean, but not very many show sizes that were two or more standard deviations from the mean. Likewise, the same would likely be true for the males' shoe sizes. We could also measure heights or weights and see similar bell-shaped curves.
In the next section, we will look at specifics regarding to the data that is collected with normal distributions.
| |||||
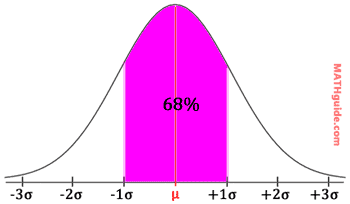
The 68-95-99 rule tells us how the data in a normal distribution will be clumped. We know that roughly 68% (or more accurately 68.2%) of the data that is collected will be within one standard deviation from the mean. The graph below illustrates it.
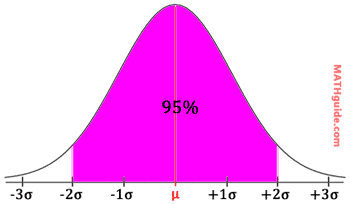
If we look at data that is two standard deviations from the mean, we should be looking at roughly 95% (or more accurately 95.4%) of the total data. Again, this is illustrated below.
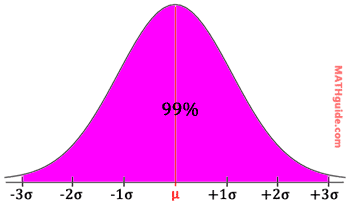
Looking at data that is within three standard deviations from the mean, we will find roughly 99% (actually closer to 99.7%) of the total data collected. Look at the illustration below.
Look at the following examples. Example 1: A machine dispenses small sodas with a mean of 4.9 ounces and a standard deviation of 0.1 ounces. What is the interval that accounts for 95% of all the small sodas it dispenses? First, we have to place numbers on number line. The mean goes in the middle and we add standard deviations to get numbers to the right of the mean.
4.9 In a line, it looks like this so far.

Next, we have to fill numbers to the left of the mean, which is marked red on the number line.
4.9

If we are looking for 95% of the data, we have to look two standard deviations from the mean. Therefore, we use the 4.7 and the 5.1, like so.

Example 2: Using the results from example 1 (above), determine: a) what percent of dispenses does the machine pour small sodas that are between 5.0 and 5.1 ounces?, b) what percent of dispenses does the machine pour small sodas that are between 4.8 and 5.1 ounces?, and c) what percent of dispenses does the machine pour small sodas that are greater than 5.1 ounces? Let us start with part (a). We know that 68% of the time, the machine pours between 4.8 and 5.0 ounces. We also know 95% of the time, the machine pours between 4.7 and 5.1 ounces. This information is placed in the diagram below.

We need to find the percent of data that rests within the sections labeled with the 'x's -- see below.

The 95% section has to be equal to the 68% plus the two 'x's. So, we need to do some algebra to solve for the x-value, like so.
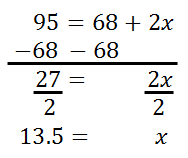
We can place this 13.5% in the diagram where it belongs, like so.

This also happens to be the interval we were looking for: the interval between 5.0 and 5.1. So, part (a) is 13.5%. Now, let us move on to part (b). We were asked to find the interval between 4.8 and 5.1. Looking at the diagram below, this should be a snap.

We simply have to combine the correct percentages, which are highlighted. This means we need to add 68% and 13.5%. Therefore, our solution for part (b) is 81.5%. Our last question is part (c): find the percent of pours that is greater than 5.1 ounces. Using our knowledge of two standard deviations, which is 95% of the data, this separates the total amount of data into three sections: the data left of 4.7, the data between 4.7 and 5.1, and the data right of 5.1. This is shown in the diagram below.

Notice that the sections left of 4.7 and right of 5.1 are unknown and marked with 'y's. They are equal because there is symmetry to normal distributions. To solve for the y-value, we have to realize that the entire data set is divided into the three sections. Only then can the following equation be constructed.

The algebra is left to the reader, but the y-value is 2.5. Therefore, the machine must pour small sodas that are greater than 5.1 ounces 2.5% of the time. | |||||
Try this quiz, which can help you learn the content above. | |||||
Try this lesson and quizmaster, which are related to the sections above.
| |||||
 esson:
 uiz:
uiz: