Expected Values | ||
| ||
Introduction | ||
In this section of MATHguide, you will learn how to calculate basic probability problems. These topics will be presented here:
|
Games are a regular part of life. They are fun. They invite creativity and competition. We study games not only to learn about common games, like poker or some other casino game. Playing games and consequently understanding their intricacies also help us understand more complicated aspects of interesting careers. When we look at those commonly known games we often discover how rich they are for learning greater concepts related to probability. With that in mind, we will take a look at a few games that involve money to determine which are favorable to the player, favorable to the house, or are fair games that favor neither the player nor the house. If you are not yet familiar with probability, examine our lesson on probability before continuing.
| |
Some games are difficult to determine who they favor. If a game favors the house (the person running the game), how much does it favor the house? To answer questions like that, we can use this formula for ‘n’ outcomes:
To best be able to demonstrate how this formula works, we can calculate a table of expected values. We have to match an expected value with the probability of attaining that value. A blank table would look like this.
The size of a table (the number of columns) depends upon the game we are studying. Look at the examples that follow to understand how to fill the table.
| |
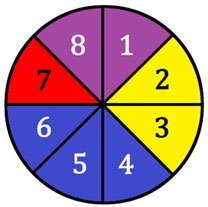
Sally has a spinner game. Here are the rules of the game:
The player pays $2 and spins the spinner. If the spinner lands on purple, the player wins $0.50. If the spinner lands on yellow, the player wins $5. If the spinner lands on blue, the player wins $1. If the spinner lands on red, the player wins nothing. To determine who this game favors, we must fill an expected values table. This requires us to know a little bit about probability, too. If all the spaces on the spinner are the same size, which is a safe assumption based upon the spinner presented here, there is a 1 in 8 chance of landing on any one space. We will use that fact to fill the table. To land on purple, there are two spaces. So, the probability of landing on purple is 2/8. Let’s fill in the table with the information for purple. Keep in mind, the expected value (amount the player wins) for purple is $0.50.
The probability of landing on yellow is the same, 2/8, because there are two yellow spaces. Since blue has 3 spaces, the chance to land on blue is 3/8. Finally, the chance to land on red is 1/8 because red occupies only 1 space out of 8 total spaces. We will fill in the rest of the information into the expected values table.
The table is almost complete. It is incomplete because we have yet to account for one crucial piece of information: the wager. To play this game, we have to wager $2. There is a 100% probability (remember, 100% = 1) of losing this $2. This will be the last entry into the table, like so.
Now that we have our table of values, we are going to multiply values times their respective probabilities, like so.
Once we gain these products, we add them together. Here is the resulting calculation:
Cleaning up the expression gives us this.
So that we can easily combine this expression, transform the -2 into eighths. -2/1 is equal to -16/8.
We now need to add the fractions. Since they are all in eighths, add the numerators.

Next, reduce the fraction.

This means a player will lose 1/4 of a dollar (or 25 cents), on average, every time the game is played. Sure, a player can land on yellow many times in a row. However, over the long haul, a player will lose a quarter per game. If a player plays 100 games, the player would likely lose 100(1/4), or $25, on average.
This example had a long explanation because it was necessary to explain all the details of the process. For the following examples, less steps will be shown.
| |
Here is a game that involves a marble bag. 
Pay $3 and pull a marble randomly from the bag. The payout depends on what color marble the player pulls, according to this chart.
To construct a table of expected values, we need to know the probabilities of pulling various marbles. First, we count up the marbles. Placing them in another chart will be the easiest way to organize our information.
The probability of grabbing a green marble is 4/10. This information will now be placed within a table of expected values.
The player has to pay $3 to begin the game. So, this will be entered within the last column. This loss will occur 100% of the time.
Now, we have to multiply our columns (expected values times their respective probabilities). This is the result.
We need to clean up this expression by multiplying the terms.
To get a common denominator, we can change -3/1 to -30/10.
The next step, we add the fractions and get this result.

This means the game gives the player 1/5 of a dollar per game, on average. If a player was to play 100 games, then that player would win (100)(1/5) = $20, on average.
| |
Here is a game that involves two dice. If the dice match (doubles are rolled), the player pays $5. How much should the house pay if the dice do not match to make the game fair? [Remember, a game is fair if the expected value of the game is $0.] To construct the table of expected values for this problem, we have to be aware of probabilities involving 6-sided dice. If you are not, please visit our lesson on the topic: Probability: Dice. Look at the sample space of rolling two 6-sided dice below. Notice the highlighted doubles. 
We can see there are six ways to get doubles. There are 36 total possible outcomes within the sample space. So, here is the probability of gaining doubles.
We can use the same sample space table above to count the number of non-doubles rolls. If there are 36 total outcomes and 6 of them are doubles, then 30 of them must not be doubles. This makes calculating the probability of rolling non-doubles to be...
Now, we need to complete an expected values table. We can fill in several pieces of information, except the outcome for non-doubles. So, we should place an 'x' as its expected value.
Now, we must multiply each expected value times its probability.
Here is the result.
Since we are trying to build a fair game, we must force this expression to be equal to zero, which is the definition of a fair game.
To solve for 'x,' we must subtract 1/2 from both sides to get this.
Next, we multiply both sides by 6/5, to get the final answer.
To create a fair game, we now know the player must pay 60 cents for rolling non-doubles.
| |
Try these lessons, which are closely related to the lessons above.
| |
 esson: